Children’s lives in the UK are changing.
They are becoming shorter in height. More of them are going hungry than they were a few years ago. Recently, more have died each year than they did a few years ago. Increased poverty, more destitution and the effects of ongoing austerity are the clear culprits.
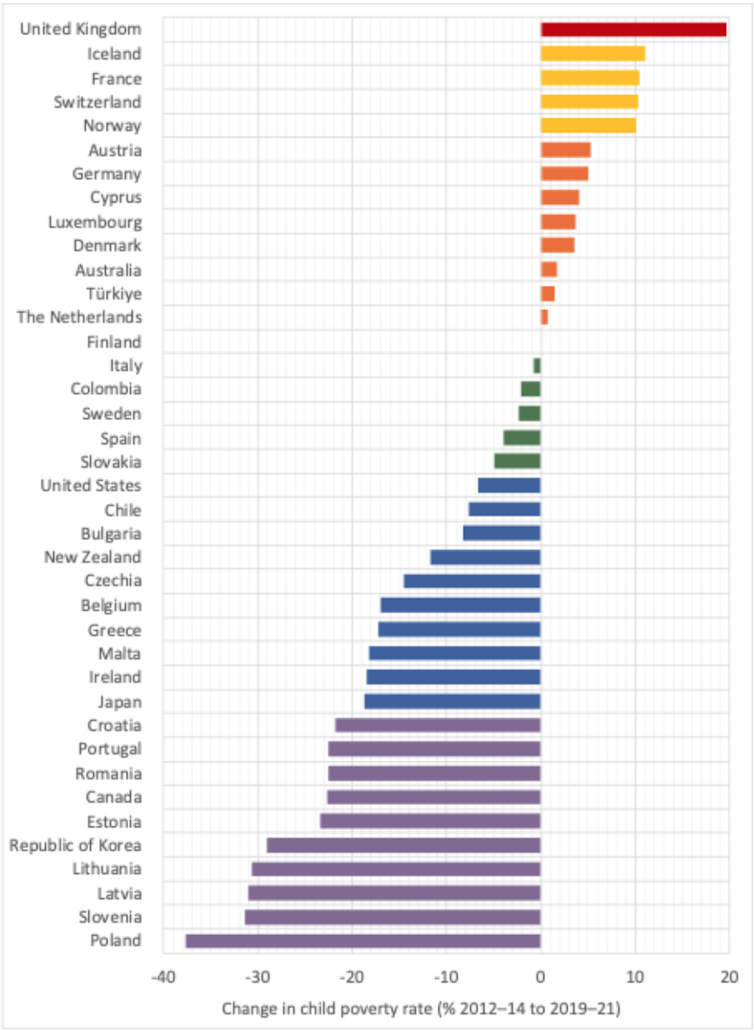
But why did this happen to our children? This rise in child poverty is a change that has not been found to have occurred to the same extent anywhere else in the world, among all the places that the United Nations measures in the same way.
Change in child poverty, 2012–14 to 2019–21

UNICEF Innocenti—Global Office of Research and Foresight (2023) ‘Innocenti Report Card 18: Child poverty in the midst of wealth’, CC BY-NC-ND
This graph tells a story of hope and success. In much of Eastern Europe, child poverty has fallen by between as much as a third – and often at least a quarter – in a mere seven years.
But it also shows that child poverty has risen the most in the UK. The poorest fifth of households in the UK are poorer than the poorest fifth in most of Eastern Europe. For many people in the UK, this will come as a surprise. Some will refuse to believe it can be this bad.
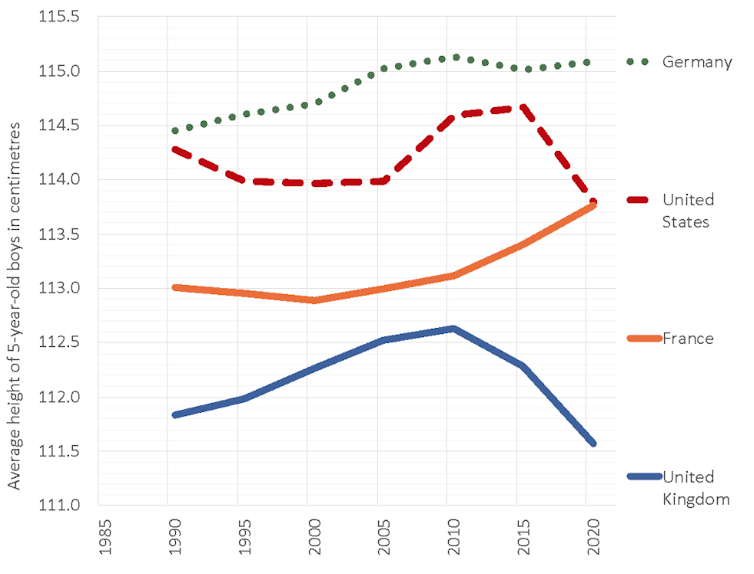
The evidence for this poverty is seen in the declining heights of five-year-olds since 2010.
Average height of five-year-old boys, 1985–2020

Redrawn by the author from data in Press Association (2023) ‘British children shorter than other five-year-olds in Europe’, ITV News, 21 June., CC BY-NC-ND
A 5-year-old in 1990 would have been born in 1985 and their height influenced mostly by nutrition in the years 1985–1990. Those were hard years for the UK: mass poverty resulting from over three million people being out of work in the early 1980s. But the average height of children was still increasing.
It was not until 2010, for those children who had lived between 2005 and 2010, that we first saw heights plateau and then fall, coinciding with the post-2010 austerity years.
My forthcoming book attempts to make sense of what has happened to the UK: why, in 2024, it is not merely one of the countries in Europe with a high rate of child poverty, but the one country above all others that the UN has singled out as having had the greatest rises in child poverty among all those it surveyed.
Seven children
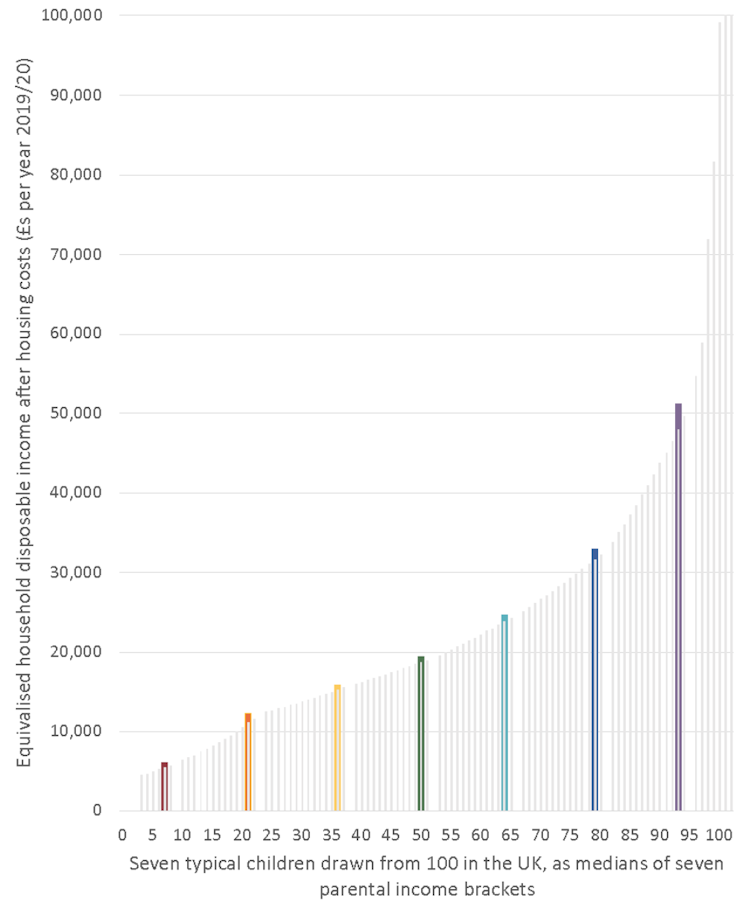
To try to understand more about children’s lives in the UK, I constructed seven typical children. I divided all 14 million children living in the UK into seven groups of 2 million, according to the income of their families in 2018 and 2019. I then chose the middle child of each 2 million. I next looked at what had happened to those families between 2018 and 2024.
The graph below shows the annual income of each of the seven households the children were drawn from.
Annual household incomes after tax, benefits and housing costs in the UK, families with children 2019/20

Danny Dorling, CC BY-NC-ND
The first thing to note is just how incredibly well-off the children are who are better-off than our seven typical children.
Some 6% of all children in the UK live in households richer than the best-off typical child in my analysis. Those 6% of children, the best-off children of all, live in families that each year receive and spend a third of all the income in the UK.

Want more politics coverage from academic experts? Every week, we bring you informed analysis of developments in government and fact check the claims being made.
Sign up for our weekly politics newsletter, delivered every Friday.
These 6% are not typical, and neither are the 6% poorest: those most destitute, those whose families are most likely to use food banks. If you pick seven typical children, equally spaced out across the income scale, then these extremes are not part of what you see.
But four of our typical seven children now live lives that most better-off people would consider to be in poverty. The other three are hardly well-off.
The least well-off are in families struggling to pay bills and making sacrifices others do not have to think about. For instance, whether to save £10 a month, or have insurance against the effects of flood, fire or theft. Increasingly often they cannot afford both.
But even the most well-off of our seven children lives in a family that worries about paying for an annual holiday. That is rare among the most affluent two million families, but possible.
The UK in 2024 demonstrates to the world what living with high inequality means in a once affluent country. It means a few using up far more resources than the vast majority of other children, such as having access to many more school teachers – per child – as compared to the rest, better food, better shelter, more warmth, more toys, better material everything; often more than you might think any child needed.
In future, almost all our children will tell their stories of growing up in the UK of the 2020s and – hopefully – what changed to make things better. It is hard to imagine them becoming much worse.
#children #live #today


